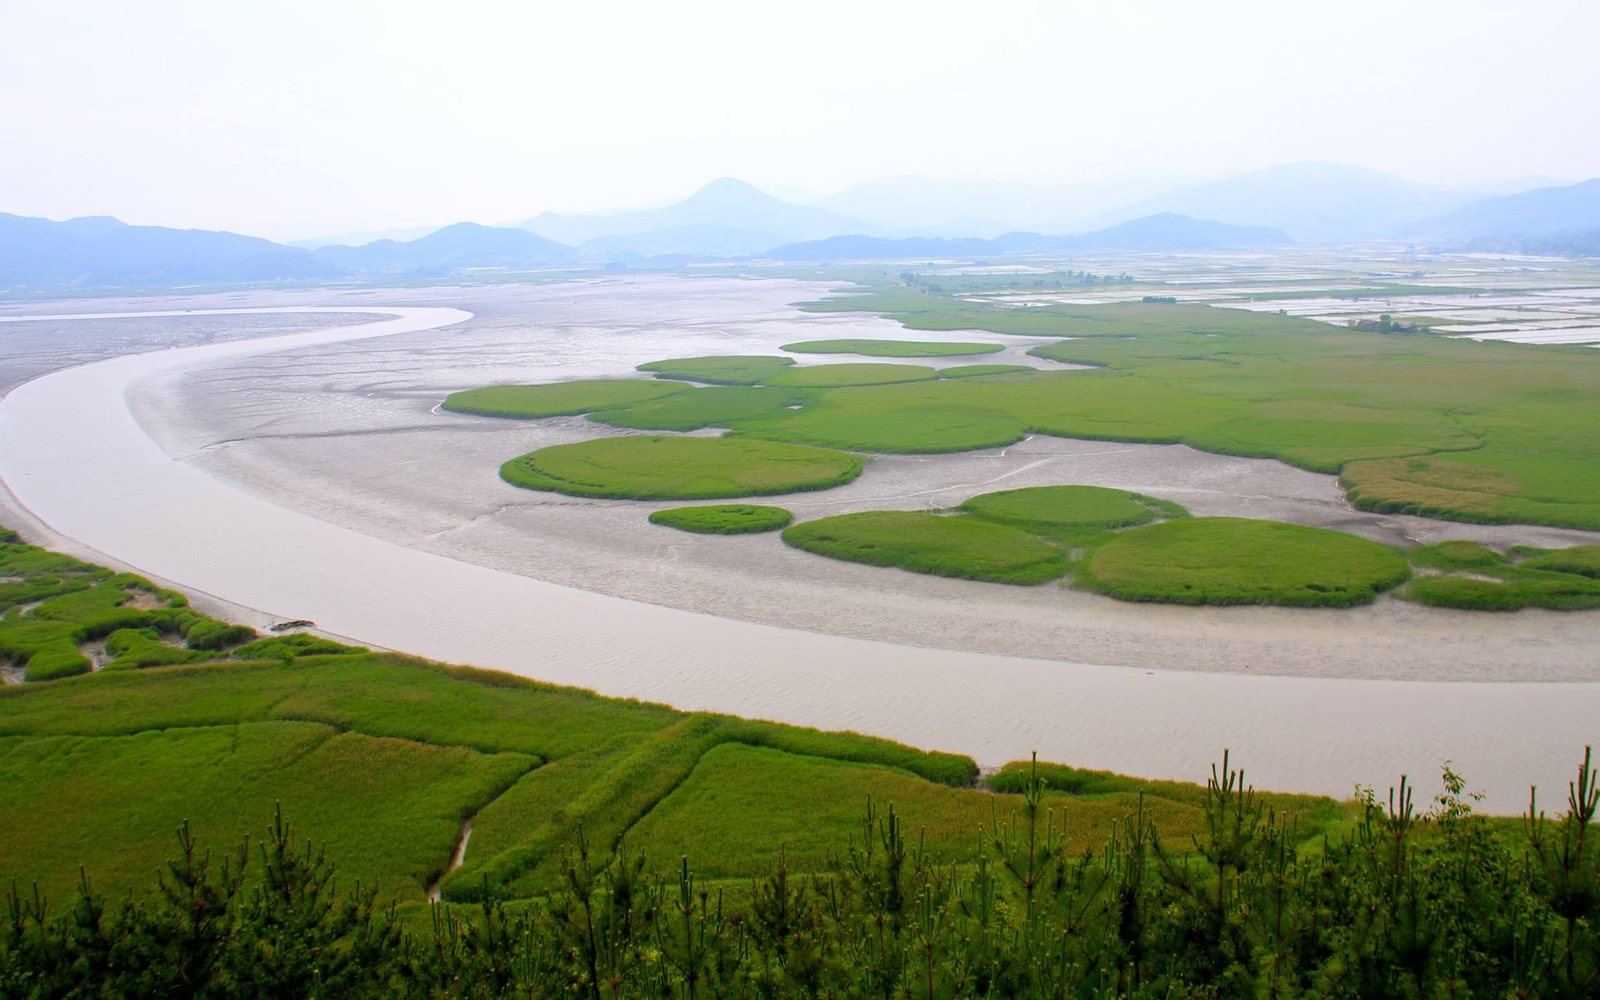
Suncheon Bay tidal flats, cover for Multispectral UAV wetland mapping
Suncheon Bay tidal flats. Photo by Joycekim77, CC BY-SA 3.0
All workRemote sensing, biosphere

Mapping tidal-flat vegetationfrom the air

UAV vs. field survey: multispectral drone imagery with texture and shape analysis for mapping the Donggeomdo tidal flats

Can a multispectral drone map salt-marsh plants as reliably as researchers wading through the mud?

Role
Independent researcher
When
2025 to present
Grades
G11 to G12
Recognition
  • Excellence Award (2nd prize), 15th Youth Biology and Ecology Paper Presentation Contest, hosted by Seoul National University College of Life Sciences and the DMZ Ecology Research Institute, November 8, 2025
Tidal-flat sites
3Tidal-flat sitesDonggeomdo, Ganghwa-gun, Incheon
Survey grid spacing
5 mSurvey grid spacingRandom points spaced 5 m apart in QGIS
Agreement threshold
κ ≥ 0.6Agreement thresholdKappa level the hypothesis treats as equivalent to field survey
Target agreement
κ = 0.75Target agreementGoal for the UAV map vs. field data
GLCM texture statistics
4GLCM texture statisticsContrast, homogeneity, entropy, correlation
Field survey
2 daysField surveyAugust 10 (Sites 1 and 2) and August 11, 2025 (Site 3)

In brief

The problem
Surveying tidal flats on foot is exhausting and slow: researchers must cover huge areas in deep mud, only during low tide, and with real safety risks from tides and weather. Data quality suffers from misidentified species, missed records and coordinate errors, and results vary with each surveyor's skill, so two teams surveying the same flat at different times may not agree.
The spark
A drone with a multispectral camera can photograph a wide area at high resolution in a short time, and vegetation indices such as NDVI capture plants' physiology and structure. The team asked whether that could stand in for, or at least back up, the traditional field survey.
The outcome
Fieldwork and the basic QGIS setup are complete: three sites were surveyed on August 10–11, 2025 and their halophyte communities recorded, from four species at Site 2 to seven at Sites 1 and 3. Drone-data processing, Random Forest classification, tidal correction and the Kappa comparison against field data are still in progress; the expected outcome is a species-level map with κ ≥ 0.6, targeting 0.75.

Method

How it was done, step by step.

  1. 1Choose sites on DonggeomdoSelected three tidal-flat sites on Donggeomdo island (Donggeom-ri, Gilsang-myeon, Ganghwa-gun, Incheon), favoring places with many earlier field studies and including both simple and complex vegetation for comparison.
  2. 2Generate survey points in QGISSaved base imagery of each site from Google Earth Pro as KML, loaded it into QGIS, outlined the tidal flat as a polygon, and generated random points spaced 5 m apart left-right and front-back; points outside the study area or unreachable were removed after GPS tracking.
  3. 3Field survey of halophytesRecorded salt-tolerant plant species at each point: Sites 1 and 2 on August 10, 2025, and Site 3 on August 11, 2025.
  4. 4Multispectral drone flightsImaged the sites with a DJI Mavic 3M, which captures narrow near-infrared and red-edge bands in addition to visible light.
  5. 5Spectral, texture and shape featuresUse NDVI and red-edge values for plant vigor, GLCM statistics (contrast, homogeneity, entropy, correlation) for surface pattern, and object-based (OBIA) segment size and shape to separate species that look spectrally similar.
  6. 6Classify and validatePlanned: classify vegetation with Random Forest after correcting for tide and season, then compare with field data using the Kappa coefficient, aiming for κ ≥ 0.6 with a target of κ = 0.75.

01Motivation

The limits of wading through mud

Traditional tidal-flat surveys ask researchers to walk into the mud for hours and examine vast areas in fine detail. That is physically draining and time-consuming, and it is only possible during low tide, so opportunities are limited. Tides and weather add real safety risks. Accuracy suffers too: species are hard to identify, records get missed, and coordinates drift. Over large areas, results depend on how experienced the surveyor is, and the same flat surveyed by another person or at another time may not produce consistent results.

  • Physical burden and labor-intensive time
  • Accuracy limits
  • Poor reproducibility

02The idea

Let the drone do the walking

Unmanned aerial vehicles use remote sensing to photograph wide areas at high resolution in a short time. Fitted with a multispectral camera and paired with vegetation indices such as NDVI, a drone can capture both the physiology and the structure of plants. The team set out to test it head-to-head against the field survey: UAV versus boots on the ground. Their hypothesis was that combining multispectral indices with texture and shape features, after correcting for tide and seasonal change, would produce a species-level map that matches the field survey at κ ≥ 0.6.

03Theory

Seeing beyond red, green and blue

A multispectral sensor records several narrow wavelength bands at once, not just visible light. Near-infrared shows plant vigor and biomass, since healthy leaves reflect it strongly, while the red-edge band reflects photosynthetic efficiency and stress. On an NDVI map, colors near red mark healthy vegetation and colors near blue mark bare ground, sand and mud. But two species can share similar NDVI values, so spectral data alone is not enough.

  • NIR: vegetation vigor and biomass
  • Red-edge: photosynthetic efficiency and stress
  • NDVI: high for plants, low for mud and sand

04Theory

Texture and shape fill the gap

Even when band values look alike, the surface pattern can differ: an evenly green patch versus a mottled one. The team adds texture analysis using the gray-level co-occurrence matrix (GLCM), which turns patterns into numbers through four statistics: contrast, homogeneity, entropy and correlation. A second supplement is shape analysis, where object-based image analysis (OBIA) groups pixels into segments and measures each one's size and shape. Together, spectrum, texture and shape give the classifier three independent ways to tell species apart.

  • GLCM: contrast, homogeneity, entropy, correlation
  • OBIA: segment size and shape

05Study site

Three plots on Donggeomdo

The study area is Donggeomdo, a small island in Donggeom-ri, Gilsang-myeon, Ganghwa-gun, Incheon. The team chose three tidal-flat sites. Selection favored places where many traditional field studies had already been done, and deliberately included both simple and complex vegetation so the drone's performance could be compared across conditions. From June to August they studied how tidal-flat field surveys are usually done, narrowed candidate sites from earlier studies, identified the halophytes living there, and fixed the final three sites.

06Method

A 5 m grid drawn in QGIS

To make the field survey match the drone data point for point, the team used QGIS, an open-source geographic information system. They saved base imagery of the three sites from Google Earth Pro as KML files, imported them, outlined only the tidal flat as a polygon, and generated random points within it spaced 5 m apart both side to side and front to back. Each point became a place to survey on the ground. After tracking in the field, points that fell outside the study area or could not be reached were deleted. The drone used was a DJI Mavic 3M.

  • Google Earth Pro → KML → QGIS
  • Tidal flat selected as a polygon
  • Random points at 5 m spacing
  • Inaccessible points removed after tracking

07Fieldwork

What grows on the flats

Sites 1 and 2 were surveyed on August 10, 2025 and Site 3 on August 11. Common reed appeared at all three. Site 2 was the simplest, with four species: reed, Carex scabrifolia, Zoysia sinica and Limonium tetragonum. Site 1 added Phacelurus latifolius, Iris laevigata and Cnidium japonicum. Site 3 had a different community, with reed, Bolboschoenus planiculmis, Phacelurus latifolius, barnyard grass, cattail and two seepweeds, Suaeda japonica and Suaeda maritima. This range from simple to complex is exactly what the comparison needs.

08Next steps

From points to a map

Completed so far: choosing and refining the topic, setting the hypothesis, establishing the three sites, and the field survey and basic QGIS work. Still ahead: processing drone data, matching specific variable values to each species in QGIS, running a Random Forest classification, comparing it with the field survey, correcting for tide, and evaluating how efficient drone-based classification is. The team expects a map at κ ≥ 0.6, targeting 0.75. If that holds, it would show UAVs can replace or complement traditional field surveys in tidal-flat monitoring.

  • Done: topic, hypothesis, sites, field survey, basic QGIS
  • Planned: Random Forest classification, comparison, efficiency evaluation
Try it

An interactive model of the work.

The data

Results, rebuilt from the original slides.

Halophyte species recorded at each siteField survey of Donggeomdo tidal flats, August 10–11, 2025. Site 2 had the simplest community.
Site 1Site 2Site 3
Common reedCommon reedCommon reed
Carex scabrifoliaCarex scabrifoliaBolboschoenus planiculmis
Zoysia sinicaZoysia sinicaPhacelurus latifolius
Limonium tetragonumLimonium tetragonumBarnyard grass
Phacelurus latifoliusCattail
Iris laevigataSuaeda japonica
Cnidium japonicumSuaeda maritima
Species richness by siteNumber of halophyte species recorded at each site.Species
  • Site 17
  • Site 24
  • Site 37
Building the survey gridHow field points were generated so they can be matched to drone pixels.
  1. 1Google Earth Pro base imagery
  2. 2Save as KML
  3. 3Import into QGIS
  4. 4Outline tidal flat as polygon
  5. 5Random points at 5 m spacing
  6. 6Remove unreachable points after tracking
Classification planSteps completed and planned as of the presentation.
  1. 1Field survey (done)
  2. 2DJI Mavic 3M multispectral flights
  3. 3NDVI and red-edge features
  4. 4GLCM texture + OBIA shape
  5. 5Tide and season correction
  6. 6Random Forest classification
  7. 7Kappa vs. field survey (target 0.75)
Feature families used to separate speciesEach feature family captures a different property of the vegetation.
FeatureSourceWhat it captures
NDVI / near-infraredMultispectral bandsVigor and biomass
Red-edgeMultispectral bandsPhotosynthetic efficiency and stress
GLCM contrast, homogeneity, entropy, correlationTexture of the imageEven vs. mottled surface patterns
OBIA segment size and shapeObject-based segmentationPlant patch form

Plain English

Terms worth knowing.

UAV
Unmanned aerial vehicle, i.e. a drone.
Multispectral camera
A camera that records several narrow bands of light, including invisible near-infrared, not just red, green and blue.
Halophyte
A plant adapted to grow in salty soil, such as on tidal flats and salt marshes.
NDVI
Normalized difference vegetation index: a score comparing near-infrared and red light. Healthy plants score high; mud and sand score low.
Red-edge
The narrow band where plant reflectance jumps from red to near-infrared; it shifts when plants are stressed.
GLCM
Gray-level co-occurrence matrix: a way to turn the texture of an image, smooth or speckled, into numbers.
OBIA
Object-based image analysis: grouping pixels into meaningful patches and classifying the patches by color, size and shape.
QGIS
Free, open-source mapping software for viewing, editing and analyzing spatial data.
Random Forest
A machine-learning method that combines many decision trees to classify data, here to label each part of the image by species.
Kappa coefficient (κ)
A score of how well two maps agree beyond chance. 1.0 is perfect agreement; 0.6 or above is treated here as matching the field survey.

Reflection

The team admits there is still a lot left: processing the drone data, comparing field and drone data, and correcting the data. But the biggest mountain, the field survey itself, and the basic QGIS work are done, and they were relieved to have climbed it.
Sources3. 다중분광 UAV 기반 연안 습지 식생 지도화 연구_발표자료.pdf (Google Drive 1gBjykWt7ThEJKI_ejMnD3aVbzdso9K3Y), final presentation titled 'UAV vs. field survey: mapping Donggeomdo tidal-flat vegetation through integrated multispectral UAV, texture and shape analysis'